Am J Clin Nutr 1998;68:576-83.
Estimation of net endogenous noncarbonic acid production in humans from
diet potassium and protein contents1-3
Lynda A Frassetto, Karen M Todd, R Curtis Morris Jr, and Anthony
Sebastian
ABSTRACT: Normal adult humans
eating Western diets have chronic, low-grade metabolic acidosis, the
severity of which is determined in part by the net rate of endogenous
noncarbonic acid production (NEAP), which varies with diet. To prevent
or reverse age-related sequelae of such diet-dependent acidosis (eg,
bone and muscle loss), methods are needed for estimating and regulating
NEAP. Because NEAP is difficult to measure directly, we sought a simple
method to estimate it from diet-composition data. We focused on protein
and potassium contents because the production of sulfuric acid from
protein metabolism and bicarbonate from dietary potassium salts of
organic acids are the major variable components of NEAP. Using steady
state renal net acid excretion (RNAE) as an index of NEAP in 141 normal
subjects eating 20 different diets, we found by multiple linear
regression analysis that RNAE [mEq/d · 10460 kJ diet (mEq/d
· 2500 kcal)] was predictable (R2 = 0.62)
from protein [g/d · 10460 kJ diet (g/d · 2500 kcal):
positive regression coefficient, P < 0.001] and potassium
[mEq/d · 10460 kJ diet (mEq/d · 2500 kcal): negative
regression coefficient, P = 0.001] contents, which were not
themselves correlated. Among diets, 71% of the variation in RNAE could
be accounted for by the ratio of protein (Pro) to potassium (K)
content: RNAE=62Pro/K - 17.9
(r=0.84,R2=0.71,P < 0.001).
Thus, by considering both the acidifying effect of protein and the
alkalinizing effect of potassium (organic anions). NEAP can be
predicted with confidence from the readily available contents of only 2
nutrients in foods. Provisionally, these findings allow estimation and
regulation of NEAP through diet modification. Am J Clin Nutr
1998;68:576-83.
KEY WORDS: Endogenous acid
production, renal net acid excretion, potassium, protein, diet,
metabolic acidosis
INTRODUCTION
Normal adult humans eating typical American diets characteristically have
chronic, low-grade metabolic acidosis (l-4). That persisting perturbation
of systemic acid-base equilibrium occurs because metabolism of the diet
releases noncarbonic acids into the systemic circulation (eg. sulfuric
acid from metabolism of protein) in amounts that exceed the amounts of
base released concomitantly (eg. bicarbonate from combustion of organic
acid salts of potassium in vegetable foods) (5, 6). The size of the
discrepancy between acid and base production determines the net
endogenous acid production rate (ie, the net acid load of the diet),
which in turn determines the degree of perturbation of systemic acid-base
equilibrium (1, 2, 4). Under normal physiologic circumstances, the net
endogenous acid production rate and the degree of the attendant low-grade
metabolic acidosis are determined primarily by the composition of the
diet (2, 4).
With advancing age, the severity of diet-dependent acidosis increases
independently of diet (3, 4). That occurs because kidney function
ordinarily declines substantially with age, resulting in a condition
similar to that of chronic renal insufficiency (7). Renal insufficiency
induces metabolic acidosis by reducing conservation of filtered
bicarbonate and excretion of acid. Failure to recognize the respective
and independent roles of age-related impaired renal acid-base regulatory
capacity and diet net acid load has until recently prevented the
recognition that low-grade metabolic acidosis is characteristically
present and worsens with age in otherwise healthy adults (2, 4).
The pathophysiologic implications of this chronic, low-grade,
diet-dependent, age-amplified metabolic acidosis have been examined by
determining the effects of neutralizing the net acid load of the diet
with a dietary supplement of base, namely potassium bicarbonate.
Potassium bicarbonate is a natural base that the body generates from the
metabolism of organic acid salts of potassium (eg. potassium citrate)
(8), whose density (ie, mmol K/kJ food item) is greatest in fruit and
vegetables. Long-term supplementation of the diet with potassium
bicarbonate has numerous anabolic effects. In postmenopausal women for
example, calcium and phosphorus balances improve (1), bone resorption
markers decrease (1), bone formation markers increase (1), nitrogen
balance improves (9), and serum growth hormone concentrations increase
(10). These findings suggest that the adverse effects of chronic,
low-grade, diet-dependent acidosis are not inconsequential and may
contribute to such age-related disturbances as bone mass decline,
osteoporosis, and muscle wasting.
One way to reduce or eliminate diet-dependent metabolic acidosis is by
eating diets that impose little or no net acid load. Present methods for
estimating the net acid load from the composition of the diet require a
detailed inventory of nutrient composition and estimates of the
gastrointestinal absorption rates of the nutrients: these methods have
been validated for only a few diets (11, 12). In vivo methods for
quantifying net endogenous acid production are complex and labor
intensive (5) and are suitable only for specialized clinical research
centers. Accordingly, simple dietary guidelines for quantifying and
regulating endogenous acid production rates do not exist. In this paper
we present a new method for estimating the net acid load of the diet from
readily available information on diet composition, specifically total
protein and potassium contents. We focused on these 2 components because
the rate of sulfuric acid production from protein metabolism and the rate
of bicarbonate generation from metabolism of intestinally absorbed
potassium salts of organic acids are major and highly variable components
of the net endogenous acid production rate (5, 6). This paper describes
the empirically derived relations between these 2 components in different
diets and how they can be used to predict net endogenous acid production.
SUBJECTS AND METHODS
For this study of normal subjects, we used the steady state rate of renal
net acid excretion ( RNAE) as an index of the net rate of endogenous
noncarbonic acid production (NEAP) (5, 6). We measured RNAE in 42
subjects. each of whom ate 1 of 6 different whole-food diets while
residing in the University of California, San Francisco (UCSF) General
Clinical Research Center. In addition, we obtained values of RNAE from
the literature for 99 subjects eating ≥ 1
of 14 whole-food diets for which pertinent data on nutrient composition
were reported (5, 11-15). In some cases the same subjects were restudied
while ingesting a second or third diet (5, 11, 13-15). Data were
accumulated for 20 different whole-food diets ingested by 141 different
subjects, reflecting a total of 199 subject-diet combinations. All
subjects ingested a diet for ≥ 1 wk, a
period previously shown to be sufficient for establishing a steady state
of acid-base equilibrium (2). Selected articles provided at minimum data
on diet protein, potassium, and energy contents. We excluded articles in
which diets were supplemented with mineral salts because such salts
typically supply acid or base equivalents.
Subjects
The subjects were healthy men and women. Subjects participating the UCSF
General Clinical Research Center studies signed informed consent
documents as specified by the university's committee on human research.
The subjects ranged in age from 17 to 73 y [data on age are lacking for 8
subjects in one article (5)].
Diets
Values for protein, potassium, and energy contents were extracted from
the available data for the 20 diets ingested by the 141 subjects included
in the analysis. For the 6 diets ingested by the subjects studied in the
UCSF General Clinical Research Center, we determined the content of those
nutrients either by direct chemical analysis or from diet-composition
tables (16). In some of the papers cited, the nutrient content was
determined from chemical analysis of the diet (5, 14, 15): in others, it
was estimated by using specific diet-composition tables cited by the
authors (11, 12).
For 13 diets sufficient information was available for separately
estimating the protein contents of the animal and vegetable foods of the
diet (5, 11, 14, 15) or by using Agriculture Handbook no. 8 (16)
as modified by chemical analyses of certain food items used by the UCSF
General Clinical Research Center. For those 13 diets we also estimated
sulfur content from the methionine and cystine contents of the listed
food items (16). Sulfur content was computed from the formula
Sulfur (mEq/diet) = 2 x [(mg
methionine/149.2) +
(2 x mg cystine/240.3)]
(1)
where 149.2 is the molecular weight of methionine and 240.3 that of
cystine. For 3 additional diets such estimation was not possible because
a detailed listing of food items was lacking, but sulfur contents were
specified by the investigators (13). Thus, sulfur contents were available
for a total of 16 diets.
For 16 diets, sufficient data were available to calculate the difference
between the inorganic cations and anions of the diet, namely
(Na+ + K+ + Ca2+ + Mg2+) -
(Cl- + P1.8-), expressed in milliequivalents. A
positive value for the difference (ie, an excess of inorganic cations, or
an anion gap) implies that the diet contains an excess of organic anions
(eg. citrate) relative to organic cations (eg. lysine), which fills the
anion gap. Because metabolism of organic anions yields base equivalents
and that of organic cations yields acid equivalents, this difference can
be taken as the potential base of the diet. Negative values of potential
base are theoretically possible but are uncommon for ordinary diets.
Because the Na+ and Cl- contents of table salt are
equal and because the contents of the 2 ions in natural foods are equal
on average (17), we omitted the mutually canceling terms Na+
and Cl- in the calculation. That allowed calculation of
potential base for diets in which the Cl- content was not
specified.
Data analysis
For analysis of the relation of diet protein content, potassium content,
and NEAP, the values for those variables were first collected into a
master database comprising the individual values of those variables
available for each subject. For the articles that failed to report values
for individual subjects (11-13, 15), only the subject-group average was
included. As a result, the master database contains individual subject
data for 56 subjects and subject-group average data for 85 subjects,
yielding a total of 73 data points. From the master database, a working
database was developed comprising the average values of the selected
variables for each group of subjects ingesting each diet, yielding a
total of 20 data points, 1 for each of the 20 diets.
Because NEAP for subjects eating the same diet varies depending on the
quantity ingested, most of the data analysis was carried out on values of
NEAP adjusted to a standard quantity of diet ingested, expressed as
energy intake, namely 10460 kJ/d (2500 kcal/d), a convenient reference
value and one that was close to the average energy intake [10033 kJ/d
(2398 kcal/d)] of the 141 subjects studied.
Laboratory analysis
RNAE, expressed as mEq/d, was determined as the sum of the excretion
rates of titratable acid and ammonium minus that of bicarbonate. In our
laboratory, the urine bicarbonate concentration was calculated from the
measured values of urine pH and carbon dioxide content by use of the
Henderson-Hasselbach equation, for which the solubility coefficient of
carbon dioxide was taken as 0.0309 and pK' was corrected for ionic
strength: pK' = 6.33 - 0.5 x ([Na+]
+ [K+])0.5, where Na+ and K+
concentrations are expressed in Eq/L. Urine total carbon dioxide content
was determined by thermal conductivity. Titratable acid concentration was
determined by titration, and urine ammonium concentration was determined
by the phenol method (18). In the articles from the literature surveys,
RNAE was calculated as described above from component assays as described
in the respective articles (5, 11-15).
Units of measure
Charged species are expressed in milliequivalents to allow calculation
(by algebraic summation) of charge balances (ie, estimation of cation or
anion gaps) necessary for conclusions about dietary potential acid or
base content. The number of milliequivalents of a charged species is
equal to the number of millimoles multiplied by the charge valance of the
species. There is no SI unit for net acid: the standard units of
milliequivalents are used throughout.
Statistical analysis
Statistical analyses were carried out with SIGMASTAT (Jandel Corp, San
Rafael, CA).
RESULTS
The subject-group averages for the 20 diets analyzed are summarized in
Table 1. In the 20 diets, protein content ranged from 39
to 193 g/d, potassium content from 40 to 133 mEq/d, energy content from
7113 to 15803 kJ/d (1700 to 3777 kcal/d), and RNAE from 12 to 136 mEq/d.
Expressed in units per day per 10460 kJ diet ingested, the corresponding
ranges were similar: protein content, 48-139 g: potassium content, 45-153
mEq; and RNAE, 18-157 mEq. The energy-adjusted values of both protein and
potassium contents were normally distributed (Kolmogorov-Smirnov test).
The ratio of protein to potassium content varied over a 5-fold range,
from 0.45 to 2.21 g/mEq. There was no significant correlation between
protein content and potassium content among diets.
By multiple linear regression analysis of the energy-adjusted variables
(Table 2), protein content and potassium content were
independent predictors of RNAE (Figure 1:
R2 = 0.62. P <0.001):
RNAE = 0.94Pro - 0.61K + 22
(2)
where Pro is protein.
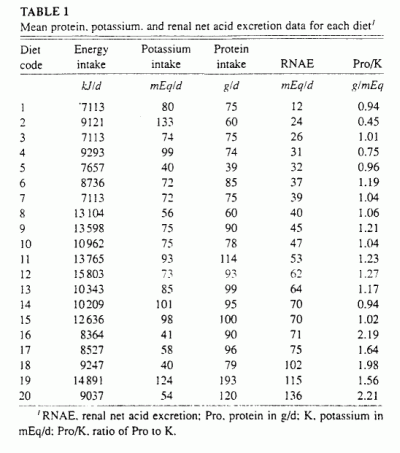
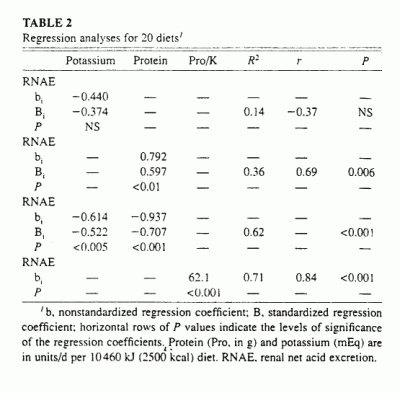
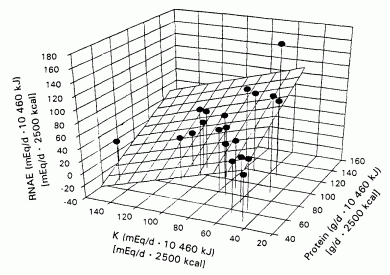
FIGURE 1. The relation between steady state renal net acid excretion (RNAE) and dietary contents of protein (Pro) and potassium for 20 different whole-food diets. RNAE - 0.94 Pro - 0.61 K + 22 iR2 = 0.62, P < 0.001). The regresion coefficients of both Pro and K were significantly different from zero. P < 0.001 and P < 0.003, respectively.
That is, the regression coefficients of both protein and potassium were
significantly different from zero, P < 0.001 and P
< 0.003, respectively. The regression coefficient of protein was
positive and that of potassium was negative, suggesting that increasing
protein content increases RNAE and increasing potassium content decreases
it. Differences in protein content had a slightly greater (1.4-fold)
effect on RNAE than did differences in potassium content, as indicated by
the values of their respective standardized regression coefficients,
namely, 0.71 compared with -0.52 (Table 2).
Similar results were obtained when the regression was performed without
adjusting the 3 variables to a constant energy content
(R2 = 0.67, P <0.001):
RNAE = 0.91Pro - 0.57K + 21
(3)
Both regression coefficients were significantly different from zero,
P <0.001 and P <0.007, respectively. Differences
in protein content had a 1.9-fold greater effect on RNAE than did
differences in potassium content, as indicated by the values of their
respective standardized regression coefficients, 0.88 compared with
-0.46.
Because protein and potassium contents were directionally opposing
independent predictors of RNAE by multiple linear regression analysis,
the ratio of protein to potassium content in the diet should provide a
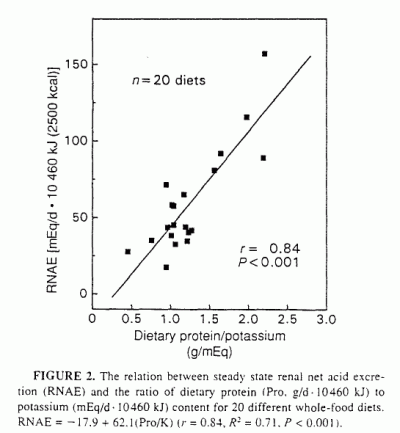
good linear index of RNAE. Thus, by linear regression analysis, RNAE
(mEq/d · 10460 kJ diet) correlated significantly with Pro/K
(g/mEq) (Table 2. Figure 2: r = 0.84,
R2 = 0.71, P < 0.001):
RNAE = - 17.9 + 62.1 (Pro/K)
(4)
Similar results were obtained when the variables were not energy adjusted
(r = 0.79, R2 = 0.62, P <
0.001):
RNAE (mEq/d) = - 10.2 + 54.5(Pro/K)
(5)
For the subset of 13 diets for which data for both animal and vegetable
foods were available, RNAE was highly correlated with animal protein
content (r = 0.84, P < 0.0005) but not with
vegetable protein content. The range of variation of vegetable protein
content (38 g/10460 kJ diet: minimum and maximum: 18 and 57 g/10460 kJ]
was much less than that of animal protein content (104 g/10460 kJ of
diet: minimum and maximum: 13 and 117 g/ 10460 kJ), a nearly 3-fold
difference. Expressing vegetable food intake in terms of energy ingested
likewise did not give a significant correlation with RNAE. The ratio of
animal to vegetable protein content of the 13 diets varied from 0.23 to
4.31, a nearly 20-fold range, and the individual values for animal and
vegetable protein contents varied independently for the diets, as did
animal and vegetable energy ingested.
In the subset of 16 diets for which data for sulfur content were
available, RNAE correlated directly with sulfur content (r =
0.75, P < 0.001; Table 3). Sulfur content in
turn correlated directly with total protein (r = 0.78.
P < 0.001, n = 16 diets; r = 084,
P < 0001, n = 13 diets) and with animal protein
(r = 0.88, P <0.001, n = 13 diets).
(Correlations for both n = 16 and n = 13 diets are
reported to allow comparison of the relation of sulfur content with both
total and animal protein contents because total protein content as known
for all diets but animal protein content for only 13 diets.)
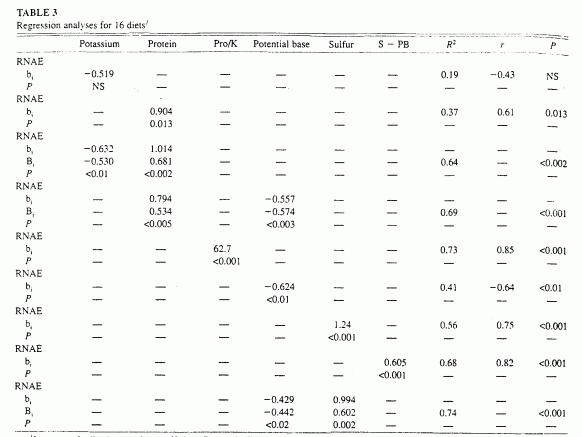
1b, nonstandardized regresion coefficient; B, standardized regression coefficient; horizontal rows of P values indicate the levels of significance of the regression coefficients. PB, potential base or K+CA+Mg - P; S, sulfur; RNAE, renal net acid excretion. Protein (Pro. in g), potassium (mEq), PB (mEq) S (mEq), and S - PB (mEq) are in units/d per 10460 kJ (2500 kcal) diet.
In the subset of 16 diets for which data were available to calculate
potential base content, potential base varied from -2 to 141 mEq/d
· 10460 kJ diet. RNAE correlated inversely with potential base
(r = -0.57, P < 0.003), and potential base in turn
correlated directly with potassium content (r = 0.89, P
< 0.001). By multiple regression analysis, potential base and protein
content together accounted for 69% of the variation in RNAE (P
< 0.001, n = 16 diets: Table 3). By comparison, for this same
subset of diets, protein and potassium content accounted for 64% of the
variation in RNAE (P <0.001). Both potassium and potential
base contents varied independently of protein content in diets.
By multiple regression analyses, sulfur and potential base contents
together accounted for 74% of the variation in RNAE among diets
(P < 0.001, n = 16 diets; Table 3). By comparison,
for those same 16 diets, protein and potassium contents together
accounted for 64% of the variation in RNAE (P <0.001).
Differences in sulfur content had a slightly greater (1.4-fold) effect on
RNAE than did differences in potential base content, as indicated by the
ratio of their respective standardized regression coefficients, 0.60 and
-0.44. respectively. That 1.4-fold greater effect of sulfur compared with
potential base on RNAE is in accord with a 1.3-fold greater effect of
total protein compared with potassium for the same diets (standardized
regression coefficients, 0.68 and -0.53. respectively; Table 3). Sulfur
and potential base contents varied independently among diets.
By simple regression analysis, we tested whether the difference between
sulfur (acid precursors) and potential base (base precursors) predicted
RNAE. Sulfur minus potential base correlated directly with RNAE and
accounted for 68% of the variation in RNAE among diets (r =
0.82, P < 0.001, n = 16 diets; Table 3,
Figure 3). For those same 16 diets, protein and
potassium correlated directly with RNAE and accounted for 73% of the
variation in RNAE among diets (r = 0.85, P <0.001).
Pro/K and sulfur minus potential base were highly correlated (r
= 0.87, P < 0.001).
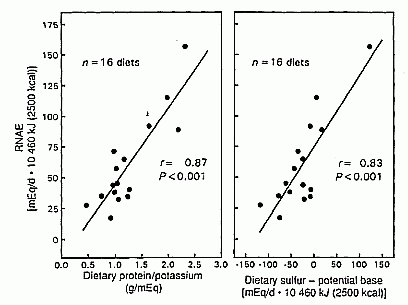
FIGURE 3. Comparison of the predictive ability of dietary sulfur minus potential base and the ratio of protein to potassium on steady state renal net acid excretion (RNAE) for the 16 of 20 diets studied for which sulfur and potential base contents were known. Protein is expressed as g/d 10460 kJ: RNAE, potassium, sulfur and potential bases are expressed as mEq/d · 10460 kJ.
Of the 20 diets studied, magnesium content was known for 18 diets. For
those diets, in mEq/10460 kJ diet, magnesium content was 27.5 ±
11.9, potassium content was 82.4 ± 29.3, and the sum of magnesium
plus potassium was 109.9 ± 37.2: magnesium content represented
≈25% of the total of magnesium plus
potassium. Incorporating magnesium content into the data analysis did not
improve the overall ability to predict RNAE. By multiple regression
analysis with protein content and total potassium and magnesium content
as the 2 independent variables, 64% of the variation in RNAE among diets
was accounted for (P < 0.001, n = 18 diets). For
those same 18 diets, protein and potassium contents alone accounted for
63% of the variation in RNAE (P < 0.001). The ratio of
protein content to total content of potassium plus magnesium (Pro/[K +
Mg]) correlated less well with RNAE (r = 0.79) than did Pro/K
alone (r = 0.85) (n = 18 diets). Substitution of
magnesium for potassium in the multiple regression model with protein did
not improve R2 (0.57 compared with 0.63), and the
ratio of protein to magnesium did not correlate significantly with RNAE
(r = 0.46, P > 0.05).
DISCUSSION
The results here indicate that in normal subjects steady state RNAE is
highly correlated with the ratio of the dietary content of total protein
to potassium (r = 0.84, P <0.001), 2 components of
the diet for which quantitative information is widely available in
standard food-composition tables. Given that steady state RNAE in normal
subjects corresponds closely with the diet dependent rate of endogenous
acid production (5), these results provide a relatively simple and
reliable method for determining and controlling the net acid load of the
diet.
In studying the acid-base effects of diet, most workers use steady state
RNAE to estimate the net acid load of the diet (ie, the net rate of NEAP)
(11-13, 19). In fact, when endogenous acid production is measured in
normal subjects by methods that are independent of measurement of RNAE,
concomitantly measured RNAE and endogenous acid production are strongly
and directly correlated (r = 0.94, P < 0.01) (5, 6).
Accordingly, in normal subjects in a steady state, RNAE is a reliable
predictor of the diet net acid load. Indeed, RNAE may be a better index
of diet net acid load than that provided by independent measurement of
net endogenous acid production because the latter inherits the cumulative
errors of the measurement of multiple inorganic constituents of the diet
and stool and of organic anions excreted in the urine (5, 6).
In the present study, using RNAE as an index of endogenous acid
production, we tested whether the net acid load of the diet could be
predicted simply from the nutrient composition of the diet. We focused on
dietary protein and potassium contents because the rate of sulfuric acid
production from protein metabolism and the rate of bicarbonate generation
from metabolism of intestinally absorbed potassium salts of organic acids
are major and highly variable components of the net endogenous acid
production rate (6). The only other quantitatively significant component
of the endogenous acid production rate is organic acid production (eg.
lactic acid), reflecting incomplete combustion of carbohydrate and fat to
carbon dioxide and water (6). Accordingly, differences in organic acid
production resulting from the different diets studied might account for
some of the unexplained variation in RNAE among diets with similar ratios
of protein to potassium content (Figure 2). That is, at any given
protein-to-potassium ratio, the observed differences in RNAE might be due
in part to differences in diet-induced organic acid production. In normal
subjects, however, organic acid production varies little among diets,
even when the diets are otherwise sufficiently different to yield a
17-fold difference in endogenous acid production over a wide range (7-122
mEq/d) similar to that observed here (11).
The validity of using diet protein content as a surrogate for sulfuric
acid production is supported by the finding that urinary sulfate
excretion correlated strongly and directly with total protein content
(r = 0.78, P < 0.001, n = 16 diets:
r = 0.84. P < 0.001, n = 13 diets) and with
animal protein content (r = 0.88, P < 0.001,
n = 13 diets). The correlation with animal protein content was
only marginally stronger than with total protein content (r =
0.84 compared with 0.88), and the slopes of the regression lines were
identical (bi = 0.81). Accordingly, for the purpose of
predicting the net acid load of the diet from the protein-to-potassium
ratio of the diet, it seems that either total protein content or animal
protein content can be used. Indeed, for the subset of 13 diets in which
animal protein content was available, the correlation of RNAE with the
ratio of animal protein to potassium was only marginally greater than
that with the ratio of total protein to potassium (r = 0.90
compared with 0.86).
Although urinary sulfur excretion correlated both with animal protein
content and with total protein content, it did not correlate
significantly with vegetable protein content. That apparent lack of
correlation may partly reflect the substantially narrower range of
variation of vegetable protein content compared with animal protein
content in the diets analyzed in this study (range of protein contents
for vegetable and animal content, respectively, 18-57 and 13-117 g/10460
kJ of diet: n = 13 diets). It may also partly reflect the
greater variation in the sulfur content of vegetable proteins compared
with that of animal proteins (ie, sulfur content per unit protein
content), a finding that is evident from food-composition tables that
report sulfur content (20).
Because the sulfur content of vegetable proteins is much more variable
than that of animals proteins (20), it may seem surprising that the ratio
of total protein (animal plus vegetable) to potassium was such a good
predictor of the diet net acid load (Figure 2). Indeed, the greater
variability of sulfur content in vegetable compared with animal protein
is evident specifically when sulfur content is computed per unit
potassium content (20). As noted above, however, differences in vegetable
protein content among the diets considered here were substantially less
than the corresponding differences in animal protein content, so
vegetable protein content would presumably have less weight as a
determinant of the overall variability in the diet net acid load. Most
important. however, for the estimation of RNAE, the data clearly show
that RNAE is highly predictable from the ratio of total protein to
potassium content over a wide range of ratios of animal to vegetable
protein content. In fact, the ratio of animal to vegetable protein
content of the studied diets varied over a nearly 20-fold range, from
0.23 to 4.31; Nevertheless, additional studies with larger numbers of
different diets will be needed to determine whether total
protein-to-potassium ratio remains generally predictive of the diet net
acid load.
Because the net rate of endogenous acid production is the difference
between the rates of acid and base production, we also sought a marker
for the content of base precursors in the diet. Dietary base precursors
are predominantly organic anions, such as citrate, succinate, and other
conjugate bases of carboxylic acids, which are predominantly
intracellular constituents that the body metabolizes to bicarbonate (6,
8). Organic and inorganic cations both balance the charge of these
anions. Organic cations, such as lysine and arginine, however, yield acid
equivalents on metabolism and thereby reduce the net base load resulting
from metabolism of organic anions (6, 8). [In ordinary diets, the content
of organic anions exceeds that of organic cations (5, 6).] Accordingly,
the effective base load from organic anions is from the metabolism of
that quantity of organic anion with charge balanced by inorganic cations
(6). As the predominant intracellular inorganic cation, potassium is the
major source of inorganic counter-ion for organic anions. Therefore, we
used dietary potassium content as an index of the content of base
precursors in the diet.
Indeed, with protein content held constant, potassium content was a
significant inverse predictor of RNAE (P < 0.003) (Table 2,
Figure 1). That is, as potassium content increased for any given protein
content, RNAE decreased (Figure 1). Over their respective ranges of
variation among diets, potassium content had about one-third less
quantitative effect on RNAE than did protein content (the protein effect
was 1.4 times greater than the potassium effect). However, together, as
independent predictors in a regression model, protein and potassium
content accounted for ≈60% (Table 2,
Figure 1) and as the ratio of protein to potassium content accounted for
≈70% of the variation in RNAE among
diets (Table 2, Figure 2).
Because cells are rich in magnesium as well as potassium, we tested
whether inclusion of diet magnesium content in the analysis would improve
the ability to predict RNAE from protein and potassium content. Magnesium
content averaged ≈≈25% of potassium
content, and the 2 were highly correlated (r = 0.77, P
< 001). Inclusion of magnesium content in the multiple regression
model with protein and potassium decreased the unaccounted variability in
RNAE by 4%; in the simple regression model of RNAE against Pro/K,
inclusion of magnesium, by using Pro/[K + Mg] instead of Pro/K, actually
increased the unaccounted variability in RNAE (by 10%). Thus,
consideration of diet magnesium content little improved, or worsened, the
ability to predict RNAE from protein and potassium content. Substitution
of magnesium for potassium in the regression models (ie, using protein
and magnesium only) also worsened the ability to predict RNAE.
Several methods for predicting or estimating the net acid load of the
diet from its nutrient composition have been reported. Remer and Manz
(11) and their colleagues developed a physiologically based calculation
model based on 1) the estimated contents of all of the major
inorganic components of the diet (Sodium, potassium, calcium, magnesium,
chloride, and phosphorus) and reference values for their fractional
intestinal absorption; 2) the estimated total protein content of
the diet, its estimated fractional intestinal absorption, and the
estimated average sulfur content of protein from methionine and cystine;
and 3) the assumption of a diet-independent of organic acid
production. Remer and Manz (11) and Manz et al (12) tested the predictive
ability of this model for several synthetic and formula diets and for 3
whole-food diets differing in protein and other nutrients. For the 3
whole-food diets, the predicted diet acid loads underestimated measured
RNAE, the differences ranging from 8 to 20 mEq/d, or from 11% to 85%,
depending on the size of the net acid load (11).
We compared the methods for estimating RNAE by using the simpler models
that we developed in this report, which depend on knowing only the
protein and potassium content of the diet, with the more complex model of
Remer and Manz (11), which requires.a more detailed inventory of diet
composition. Specifically, to compare the 2 predictors, Pro/K and the
Remer-Manz multivariable-calculated RNAE, we computed RNAE according to
the Remer-Manz model for all of the diets used in the present study for
which sufficient data were available in the published reports to permit
that computation (11 diets), and we also computed Pro/K for those diets.
Pro/K and the Remer-Manz calculated RNAE were highly correlated
(r = 0.90, P <0.001, n = 11). With protein
and potassium used as independent variables in a multiple regression
analysis, the RNAE calculated by the Remer-Manz model varied directly
with protein content (P < 0.001) and inversely with potassium
content (P = 0.006). and the multiple correlation coefficient
was 0.93. Thus, most of the RNAE-predictive power of the Remer-Manz model
resides in the protein and potassium contents of the diets.
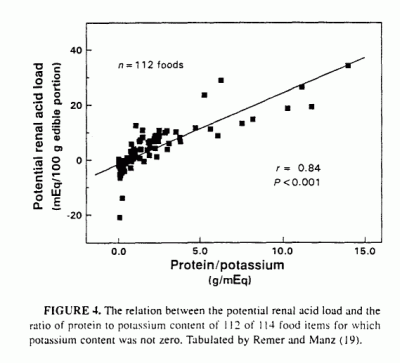
If the net acid load of whole-food diets can be predicted from their
protein and potassium content, then for any large number and variety of
individual food items composing such diets, the potential net acid load
of the individual food items should correlate highly with their protein
and potassium content. That follows because whole-food diets are simply
mixtures of a variety of individual food items. Fortunately, it is
possible to test for this, because Remer and Manz (19) presented tabular
data on the potential net acid load of a large number and variety of
individual food items, calculated according to their model, which
incorporates all of the major inorganic constituents of the diet plus an
estimate of potential sulfuric acid production from protein content. They
refer to the potential net acid load of a food item as the PRAL. or
potential renal acid load. Using their data for 112 different food items
in 10 different categories of foods, we found that PRAL and Pro/K were
highly correlated (r = 0.84, P < 0.001:
Figure 4). (Two of 114 tabulated food items were omitted
because the listed potassium content was zero, which would have yielded
infinite values for Pro/K.) As was the case for the 11 whole-food diets
discussed in the preceding paragraph, using protein and potassium as
independent variables in a multiple regression analysis. RNAE, which is
equivalent to PRAL, varied directly with protein content (P <
0.001) and inversely with potassium content (P < 0.01), and
the multiple correlation coefficient was 0.93. Thus, again, most of the
RNAE or PRAL-predictive power of the Remer-Manz multiple-variable model
resides in only 2 diet constituents, protein and potassium, taken
together. In summary, the results of this study indicate that in normal
humans eating ordinary whole-food diets, the major determinants of
differences in NEAP rate among subjects are differences in the protein
and potassium content of the diet and that the absolute rate of net
endogenous acid production for a given diet can be predicted simply from
knowledge of the diet’s protein and potassium content.
We thank the nursing, dietary, and laboratory staffs of the General
Clinical Research Center for their assistance in carrying out these
studies.
REFERENCES
1. Sebastian A, Harris ST, Ottaway JH, Todd KM, Morris RC Jr. Improved
mineral balance and skeletal metabolism in postmenopausal women treated
with potassium bicarbonate. N Engl J Med 1994;330:1776-81,
2. Kurtz I, Maher T, Hulter HN, Schambelan M, Sebastian A. Effect of diet
on plasma acid-base composition in normal humans. Kidney Int
1983;24:670-80.
3. Frassetto L, Sebastian A. Age and systemic acid-base equilibrium:
analysis of published data. J Gerontol 1996:51A:B91-9.
4. Frassetto L, Morris RC Jr, Sebastian A. Effect of age on blood
acid-base composition in adult humans: role of age-related renal
functional decline. Am J Physiol 1996:271;1114-22.
5. Lennon EJ, Lemann J Jr, Litzow JR. The effect of diet and stool
composition on the net external acid balance of normal subjects. J Clin
Invest 1966;45:1601-7.
6. Kleinman JG, Lemann J Jr. Acid production. In: Maxwell MH, Kleeman CR,
Narins RG, eds. Clinical disorders of fluid and electrolyte metabolism.
4th ed. New York: McGraw Hill, 1987:159-73.
7. Lindeman RD, Tobin J, Shock NW. Longitudinal studies on the rate of
decline in renal function with age. J Am Geriatr Soc 1985; 33:278-85.
8. Halperin ML. Metabolism and acid-base physiology. Artif Organs
1982;6:357-62.
9. Frassetto L, Morris RC Jr, Sebastian A. Potassium bicarbonate reduces
urinary nitrogen excretion in postmenopausal women. J Clin Endocrinol
Metab 1997;82:254-9.
10. Frassetto L, Morris RC Jr, Sebastian A. Potassium bicarbonate
increases serum growth hormone concentrations in postmenopausal women. J
Am Soc Nephrol 1996;10:1349 (abstr).
11. Remer T, Manz F. Estimation of the renal net acid excretion by adults
consuming diets containing variable amounts of protein. Am J Clin Nutr
1994;59:1356-61.
12. Manz F, Remer T, Decher-Spliethoff E, et al. Effects of a high
protein intake on renal acid excretion in body builders. Z Ernahrungswiss
1995;34:10-5.
13. Breslau NA, Brinkley L, Hill KD, Pak CYC. Relationship of animal
protein-rich diet to kidney stone formation and calcium metabolism. J
Clin Endocrinol Metab 1988;66:140-6.
14. Lutz J. Calcium balance and acid-base status of women as affected by
increased protein intake and by sodium bicarbonate ingestion. Am J Clin
Nutr 1984;39:281-8.
15. Lewis NM, Marcus MSK, Behling AR, Greger JL. Calcium supplements and
milk: effects on acid-base balance and on retention of calcium,
magnesium, and phosphorus. Am J Clin Nutr 1989;49:527-33.
16. US Department of Agriculture. Agricultural handbook no. 8:
composition of foods. Washington, DC: US Government Printing Office,
1997.
17. Yarbrough S, Nix L, Katz R, Korn M, Sebastian A. The quantitative
distribution of chloride in food and relation to sodium content. J Am
Diet Assoc 1988;4:472-5.
18. De Giorgio J. Nonprotein nitrogenous constituents. In: Henry RJ,
Cannon DC, Winkelman JW, eds. Clinical chemistry. Principles and
technics. New York: Harper and Row. 1974:522-6.
19. Remer T, Manz F. Potential renal acid load of foods and its influence
on urine pH. J Am Diet Assoc 1995;95:791-7.
20. Holland B, Welch AA, Unwin ID, Buss DH, Paul AA, Southgate DAT.
McCance and Widdowson's the composition of foods. 5th ed. Cambridge. UK:
The Royal Society of Chemistry, 1991.
1
From the Department of Medicine and General Clinical Research Center,
University of California, San Francisco.
2 Supported in part by the General
Clinical Research Center. UCSF (grant M01 00079): the National Institutes
of Health (grants P01DK 39964 and R01HL47943): the University of
California Research Evaluations and Allocation Committee (grant MSC-22):
a grant from the UCSF Academic Senate: and gifts from Church & Dwight
Co. Inc. and the Emil Mosbacher. Jr. Foundation.
3 Address reprint requests to A
Sebastian, Box 0126, University of California, San Francisco, CA 94143.
E-mail: sebastia@gcrc.ucsf.edu.
Received November 7, 1997.
Accepted for publication February 23, 1998.
This page was first uploaded to The Magnesium Web Site on December 17,
2002
http://www.mgwater.com/


