JUSTIFICATION OF THE INTERMEDIATE CALCULATIONS IN SUPPORT OF
THE ARTICLE, "Calculations Of American Deaths Caused By Magnesium
Deficiency, As Projected From International Data"
Paul Mason, editor
Magnesium Web Site, www.MgWater.com,
ray@mgwater.com
I N D E X
SECTION 1.
Mg Death Rates in Benchmark Countries
SECTION 2. Projected U. S.
Populations From Each Article
SECTION 3. Special
Calculation for Projection: Age 65-74
SECTION 4. Statistical
Sources of Calculations of American Populations of Comparable Age
and Sex Ranges
SECTION 5. Final
Calculations
SECTION 1: Mg DEATH
RATES IN BENCHMARK COUNTRIES
GREAT BRITAIN
Crawford, T., Crawford, Margaret D., Prevalence and
pathological changes of ischaemic heart-disease in a hard-water
and in a soft-water area, Lancet, pp. 229-232, February 4,
1967.
On page 299, from Table 1 (death rates per 100,000):
Total all cardiovascular disease in Glasgow (soft):
85+855+44+454=1438
Total all cardiovascular disease in Greater London (hard):
49+581+22+242=894
Subtract 894 from 1438 giving 544.
Divide by 100,000 giving .00544.
Divide by 3 years giving a death rate of .001813
FINLAND
Punsar, S., Karvonen, M. J., Drinking Water Quality and Sudden
Death: Observations from West and East Finland, Cardiology,
64:24-34, 1979.
On page 27, from Table 1:
Total coronary deaths and other cardiac deaths in E. Finland
(soft):121+18=139
Divide by 823 to get 16.889 percent.
Total coronary deaths and other cardiac deaths in W. Finland
(hard):77+12=89
Divide by 888 to get 10.023 percent.
Subtract 10.023 from 16.889 giving 6.867 percent.
Express as a decimal, .06867.
Divide by 15 years giving a death rate of .004578.
ONTARIO, CANADA
Anderson, T. W., Leriche, W. H., Hewitt, D., Neri,L. C.,
Magnesium, water hardness, and heart disease, Magnesium in Health
and Disease, pp. 565-571, 1980.
On page 567 of the study (document 63), from table,
Deaths/100,000, find the numbers for soft, 195 and hard, 120.
(Exact numbers are confirmed in doc.#75.)
Subtract 120 from 195 giving 75.
Divide by 100,000 giving a death rate of .00075
INDIA
Singh, R. B., Effect of dietary magnesium supplementation in
the prevention of coronary heart disease and sudden cardiac
death, Magnesium Trace Elem 9: 143-151, 1990.
On page 148, from table 4, total SCD and deaths due to
myocardial infarction for Group B, soft: 24+6=30.
Divide by 194 to get 15.464 percent.
Total SCD and deaths due to myocardial infarction for Group A,
hard: 16+3=19.
Divide by 206 to get 9.223 percent.
Subtract 9.223 from 15.464 giving 6.241 percent.
Express as a decimal, .06241.
Divide by 10 years giving a death rate of .006241
Projections for American Populations in 1994 were taken from
the World Almanac and Book of Facts, 1988, edited by Mark S.
Hoffman, page 536.
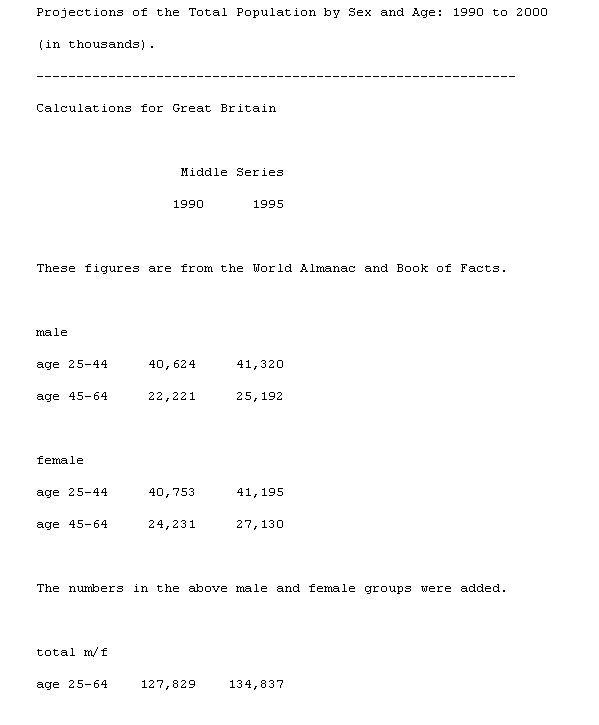
The 1990 number was subtracted from the 1995 number. The
difference was divided by six for the six years 1990 through
1995, multiplied by 5, and added to the 1990 number to estimate
the 1994 projection. This was multiplied by 1000.
133,669,000 is the 1994 projected U. S. population from the
British article: Crawford, T., Crawford, Margaret D., Prevalence
and pathological changes of ischaemic heart-disease in a
hard-water and in a soft-water area, Lancet, pp. 229-232,
February 4, 1967.
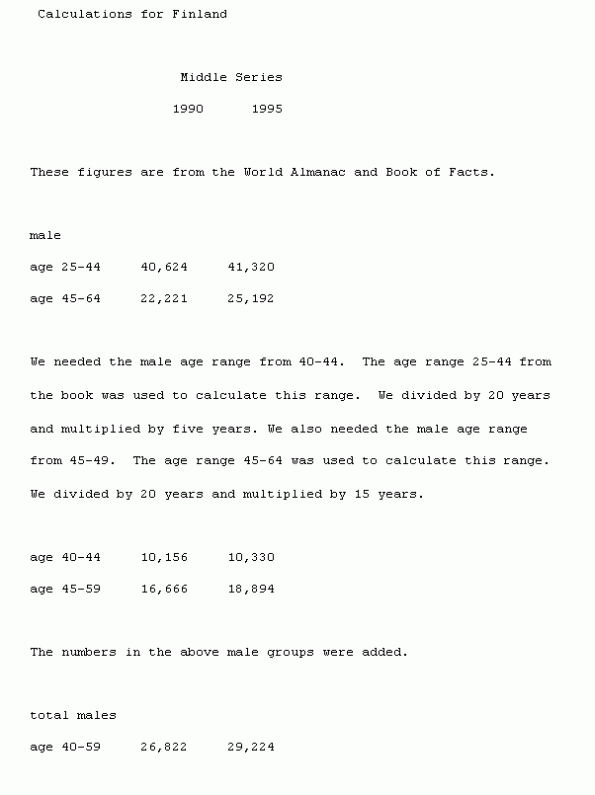
The 1990 number was subtracted from the 1995 number. The
difference was divided by six for the six years 1990 through
1995, multiplied by 5, and added to the 1990 number to estimate
the 1994 projection. This was multiplied by 1000. 28,823,625 is
the projected 1994 U. S. population from the Finland article:
Punsar, S., Karvonen, M. J., Drinking Water Quality and Sudden
Death: Observations from West and East Finland, Cardiology,
64:24-34, 1979.
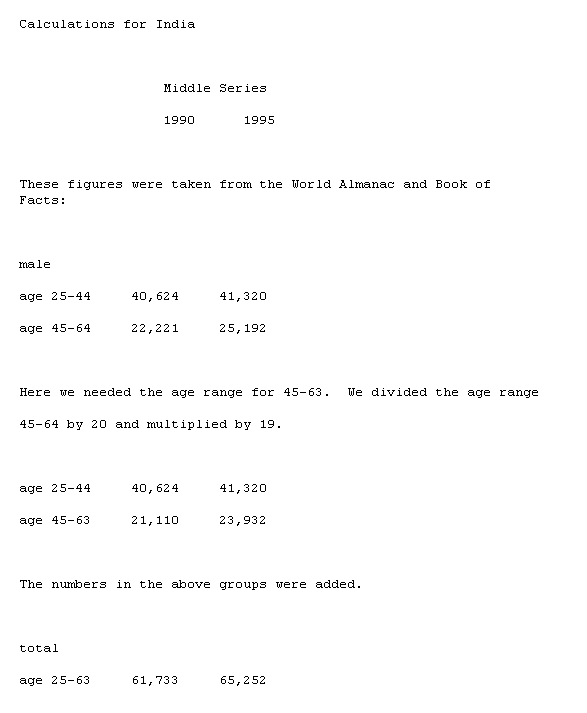
The 1990 number was subtracted from the 1995 number. The
difference was divided by six for the six years 1990 through
1995, multiplied by 5, and added to the 1990 number to estimate
the 1994 projection. This was multiplied by 1000.
64,665,992 is the projected 1994 U. S. population from the
Indian article: Singh, R. B., Effect of dietary magnesium
supplementation in the prevention of coronary heart disease and
sudden cardiac death, Magnesium Trace Elem 9: 143-151, 1990.
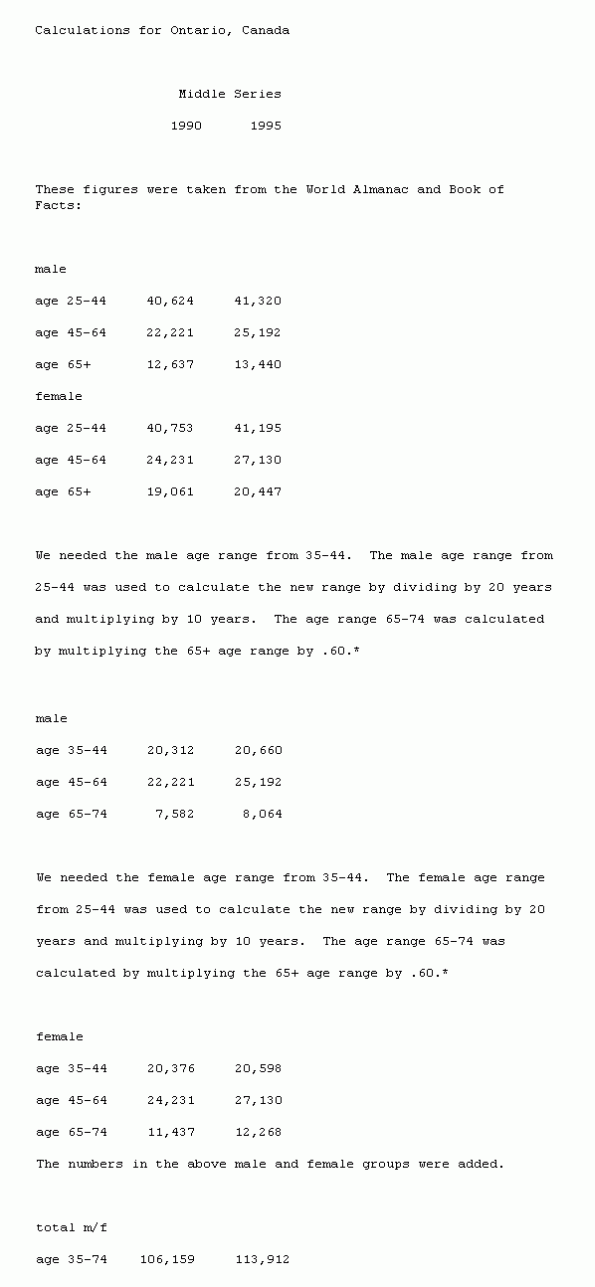
The 1990 number was subtracted from the 1995 number. The
difference was divided by six for the six years 1990 through
1995, multiplied by 5, and added to the 1990 number to estimate
the 1994 projection. This was multiplied by 1000.
112,619,833 is the projected 1994 U. S. population from the
Ontario article: Anderson, T. W., Leriche, W. H., Hewitt, D.,
Neri, L. C., Magnesium, water hardness, and heart disease,
Magnesium in Health and Disease, pp. 565-571, 1980.
* See SECTION 3, Special Calculation for Projection: Age
65-74
SECTION 3. Special
Calculation for Projection: Age 65-74
The projection from the Ontario article required the U. S.
population in the age range of 65-74, but that information was
not directly available from our census data sources; however, the
percentage of the population in that age group was available from
another source, which led to the following calculations to obtain
the figure we needed.
The following table is derived from:
Statistical Abstract of the United States (112th Edition),
1992, The National Data Book, U.S. Department of Commerce,
Economics and Statistics Administration, page 38. No. 39.
Population 65 Years Old and Over, by Age Group and Sex: 1970 to
1991, page 38.
This table was used to determine an estimate of the percentage
of total population over 65 that falls within the 65-74 age
range.
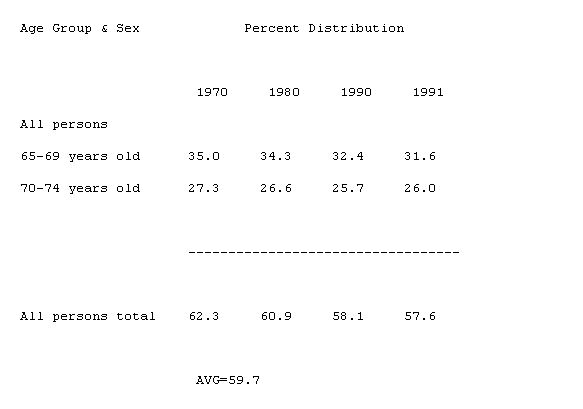
The average percent of persons in the 65-74 age group was 59.7
for the years 1970-1991. Note that the earlier years figures are
higher because more people are living longer now. Thus, since we
are going back to 1940, 60 percent is our estimate of the number
of people falling in this age range.
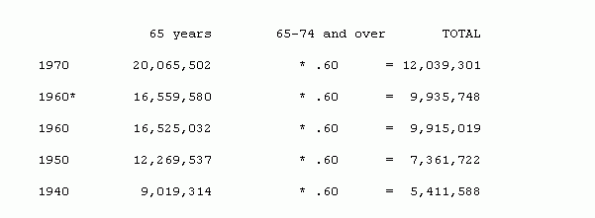
From HISTORICAL STATISTICS OF THE UNITED STATES, Colonial
Times To 1970, Part 1, Series A 119-134, Population, by Age, Sex,
Race, and Nativity: 1790 to 1970, we converted the following
number from a 65-years-and-over range to a 65-74 age range:
From the total population table below, the average numbers of
persons in each age range from 25-64 were totaled giving an
American population of the sex and age range used in the BRITISH
study: 90,131,722
From the male population table below, the average numbers of
males in each range from 40-59 were totaled giving an American
population of the sex and age range used in the FINNISH study:
20,335,107
From the total population table below, the average numbers of
persons in each age range from 35-74 were totaled giving an
American population of the sex and age range used in the CANADIAN
study: 73,351,322
From the male population table below, the average numbers of
males in each range from 25-64 were totaled giving an American
population of the approximate sex (the study actually included
6.5% females) and approximate age range used (25-63) in the
INDIAN study. The total was adjusted down one year by dividing by
40 years and multiplying by 39 years. 43,080,833
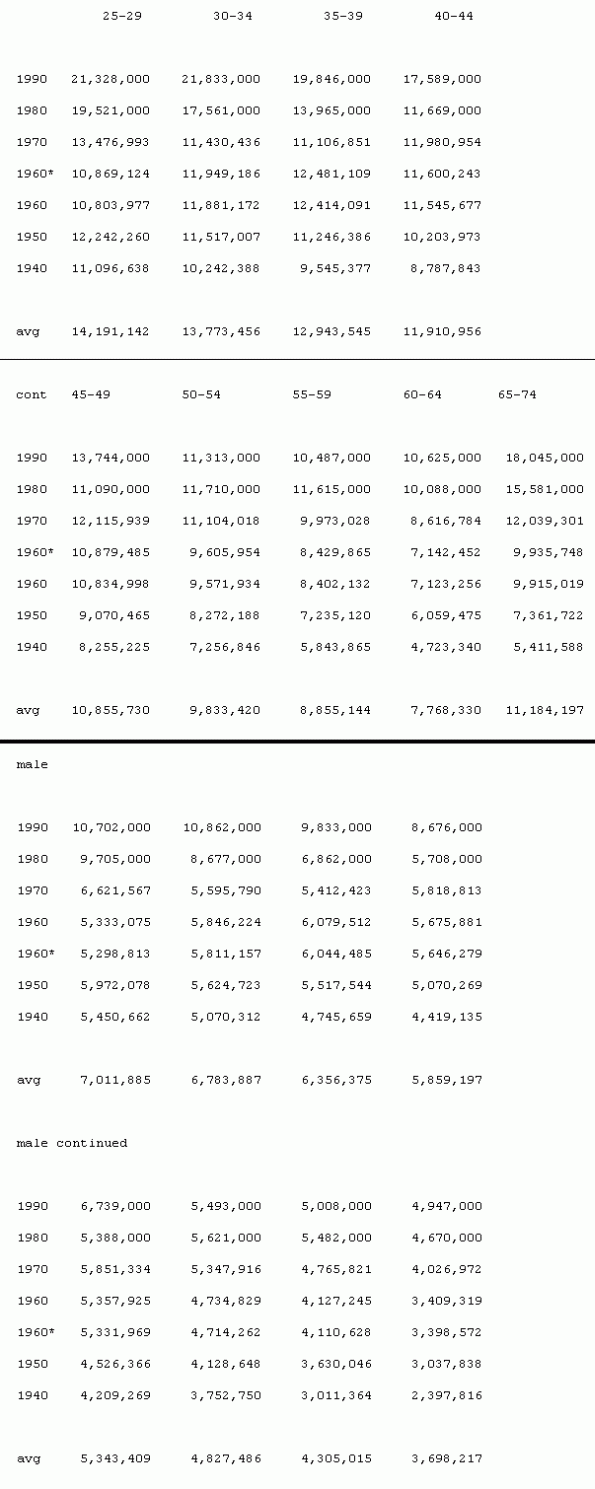
The following were used to compile the tables of total U. S.
population by age group and male U.S. population by age
group.
Historical Statistics of the United States, Colonial Times to
1970, Part 1, U.S. Department of Commerce, Bureau of the Census.
Washington, D.C., 1975, page 19. No. 19. Resident Population, by
Age and Sex: 1979 to 1991. (Figures from this table are shown in
standard type.)
Historical Statistics of the United States, Colonial Times to
1970, Part 1, U.S. Department of Commerce, Bureau of the Census.
Washington, D.C., 1975, page 15. Series A 119-134. Population, by
Age, Sex, Race and Nativity: 1790 to 1970. (Figures from this
table are shown in italic type.)
Statistical Abstract of the United States (112th Edition),
1992, The National Data Book, U.S. Department of Commerce,
Economics and Statistics Administration, page 38. No. 39.
Population 65 Years Old and Over, by Age Group and Sex: 1970 to
1991, page 38. This table was used to determine an estimate of
the percentage of total population over 65 that falls within the
65-74 age range. Figures from Series A 119-134 were multiplied by
60 percent. (These estimated figures are shown in bold type.) For
details see SECTION 3, Special Calculation for Projection: Age
65-74.
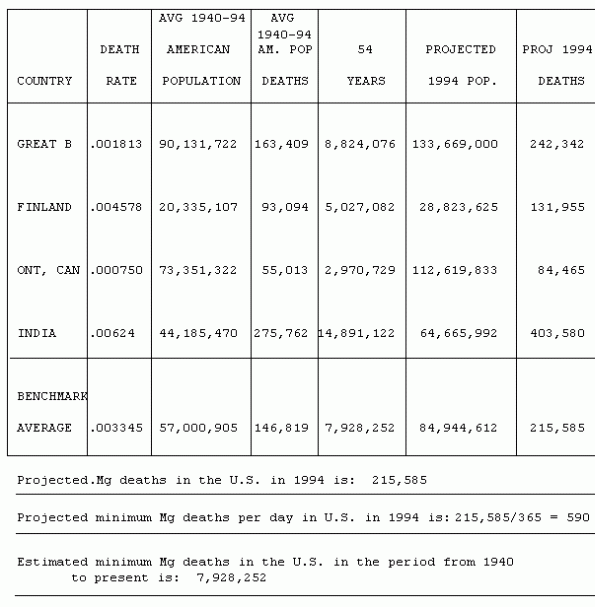
If the same rate of death from magnesium deficiency is
applicable to the entire population, including the high-risk
groups of infants and the aged, the following calculation can be
made, (assuming that the current population of the United States
is 260,000,000, as I have heard on the radio):
260,000,000 * .003345 = 869,700 U.S. deaths per annum from Mg
deficiency
Dividing 215,585 by 869,700 gives .248, which is the ratio of
U. S. Benchmark Average deaths in 1994 (limited by age and sex)
to the possible total of U. S. deaths from Mg-deficiency in the
entire population in 1994. This ratio is relevant to the
Magnesium Deficiency Death Index (MDDI) formulas given in the
article, Calculations of American Deaths...
To apply the average benchmark Mg death rate to the entire
population 1940-1994, including the high risk groups of infants
and the aged, make this calculation:
1 / .248 * 7,928,252 = 31,968,758 Mg deaths
Sudden cardiac death is known to peak between 0 and 6 months,
and between 45-75 years, according to Zipes, D. P., SUDDEN
CARDIAC DEATH, American Journal of Cardiology, Feb. '79.
Paul Mason
paulmason@mgwater.com
8/4/94
This page was first uploaded to The Magnesium Web Site on
September 30, 1995
http://www.mgwater.com/


